
Stock Ideas Pipeline
New tool release: a structured workspace where I track, analyze, and prepare stock ideas before they turn into trades

Hey guys,
This one marks the release of a new tool to help you stay on the same page with my trading style.
The existing ones are: 1) Substack chat, where I share situational updates on the market and my portfolio; 2) Portfolio Dashboard, which shows the option book structure, options structures initiated, and target returns.
Now, I’m adding the Stock Ideas Pipeline - a structured database that combines a watchlist with the key fundamentals I use to build an option trade.
The database is built around the essential info I look at when analyzing a stock and deciding whether to act.
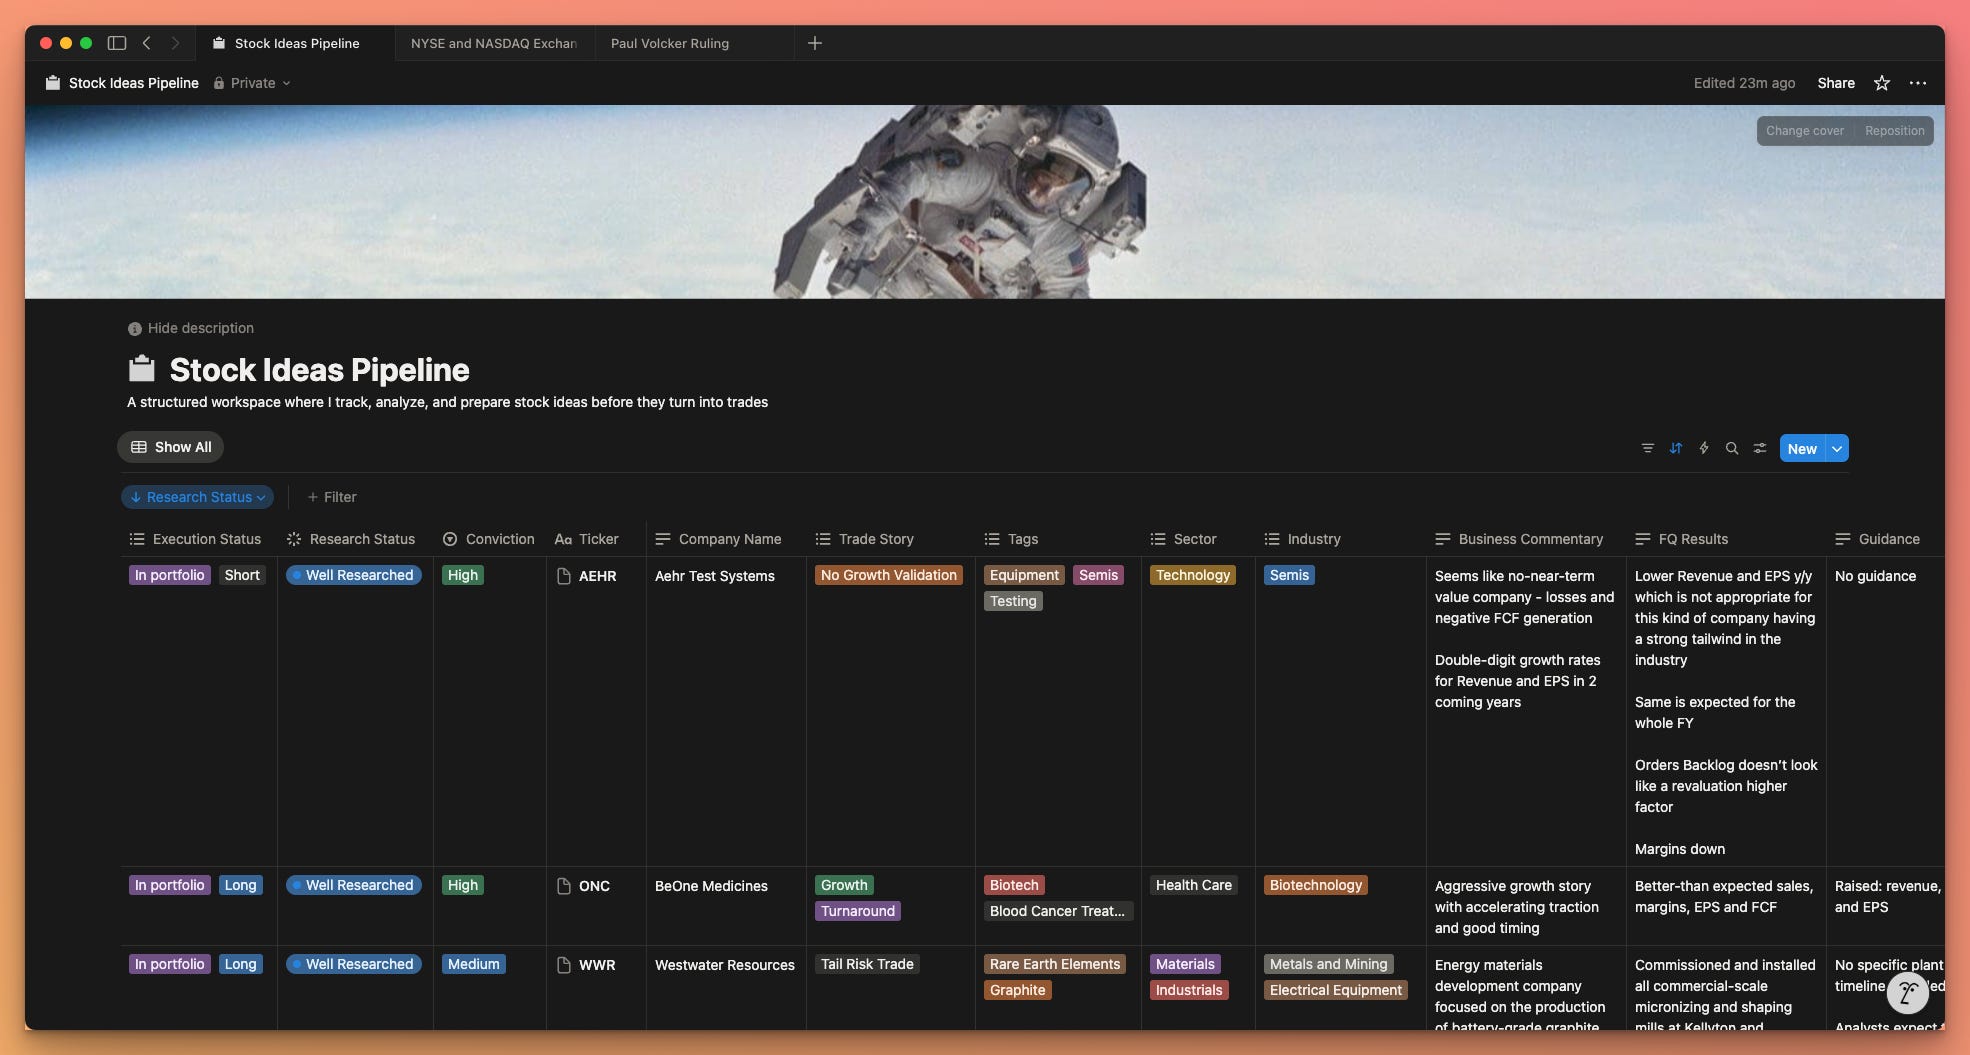
Pillar I: Trade Info
Execution Status: whether the stock is already in the portfolio, shortlisted after analysis, or on hold - plus whether it’s a potential long or short.
Research Status: Backlog, Research Next, or Well Researched.
Conviction: High, Medium, or Low.
Pillar II: Analysis
Ticker and Company Name: the object of analysis.
Trade Story: trade type and logic, helping to define timing and position sizing.
Tags: for filtering trade themes later.
Sector & Industry: straightforward.
Business Commentary: how I see the company’s business and the key trade points.
FQ Results: highlights from the most recent quarterly report.
Guidance: what management projects for the next periods.
Shareholder value: trends in share count and dividend payouts.
Catalysts: specific events that could move the company’s valuation.
Risks: factors that could challenge the trade narrative.
Price Action: notes on the technical setup.
Price Target: the price level I expect to be reached within a quarter.
Latest Update: when I last reviewed the company.
More factors might be added later, but the core structure is already there.
I’ll keep migrating my existing research into this database - around 100 companies more to migrate, and I analyze 2–3 new ones daily.
Now we have 3 premium tools available for paid subscribers:
Substack chat where I comment on markets and trades.
Portfolio Dashboard to track trades I execute in live and monitor my current long/short option book.
Stock Ideas Pipeline where I track, analyze, and prepare stock ideas before they turn into trades.
Access links to these tools will be shared in the Chat.
Become a paid subscriber to get one step closer to proficient stock options trading.
2 more tools are in the works. Once I finish building the analytics that make tracking my strategy easier, I’ll shift focus to educational content helping you master the process behind it.
How is the strategy performing so far?
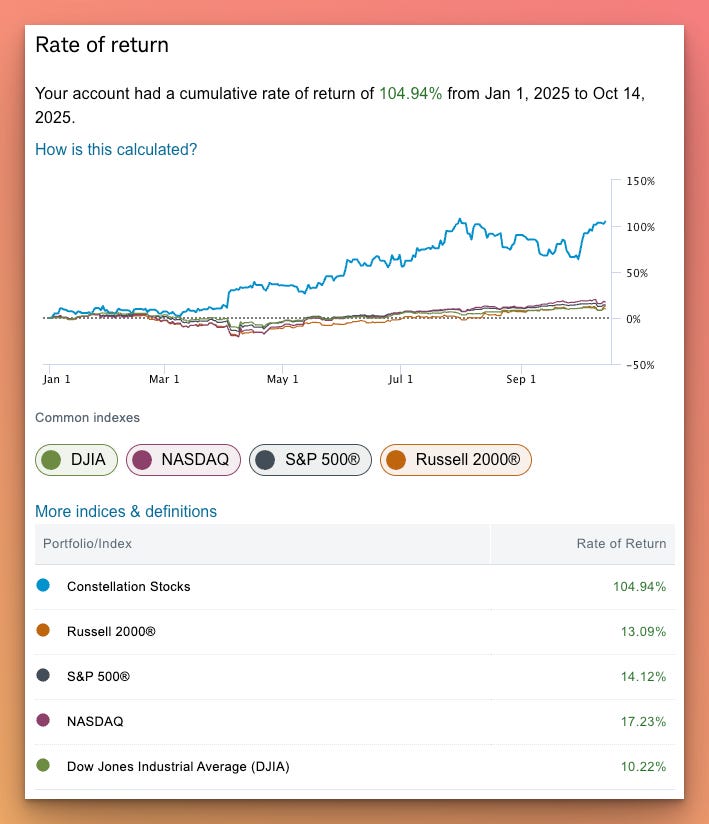
How is this calculated? (Broker’s information)
We use the daily time-weighted return method to find your rate of return. This method calculates daily value changes, then adjusts for the timing and size of any contributions and withdrawals you made.
Show Example
Alex’s portfolio is valued at $10,000 on January 1. By July 1, the account value has risen to $12,500. Alex then invests $5,000 on July 1, resulting in a new value of $17,500. By the end of the year, the account value has risen again to $20,000.

How would we calculate Alex’s rate of return from January 1 to December 31, considering the contribution made on July 1?
Step 1: Divide the overall time period into sub-periods based on times where Alex contributed or withdrew money.
Jan 1–Jul 1: Sub-period #1
Jul 1–Dec 31: Sub-period #2
Step 2: Find the rate of return for each sub-period using this calculation:
((Ending value – net contributions) / beginning value) – 1 = sub-period return
Sub-period #1: (12,500 / 10,000) – 1 = 25.0%
Sub-period #2: (20,000 / 17,500) – 1= 14.3%
Step 3: Combine the returns using this calculation:
(1 + sub-period #1 return) × (1 + sub-period #2 return) – 1
(1 + 0.250) x (1 + 0.143) – 1 = 42.9%
Alex’s daily time-weighted return from Jan 1 to Dec 31: 42.9%
Cumulative and annualized returns
In our example, we looked for the rate of return for an portfolio for one year. The value we found is called a cumulative return.
For time periods longer than a year, we can look for an annualized return. An annualized return is the average rate of return each year. This can be helpful when comparing your performance to market indexes, whose returns are always annualized.
If your time period is longer than 365 days, you can see this number by checking the “Show annualized returns” box. Note: This will not affect the numbers shown on the chart.