
October Performance Recap: monthly return +10.6%, cumulative YTD return +101.22%
Portfolio drivers: USAR, TMUS, IONQ. 17 trades closed, 8 winners, 9 losers, dollar win to loss 1.86x

Hi everyone,
Happy Weekend!
Here is the strategy performance recap for October 2025.
October was a fruitful month with realized outcomes from 17 trades: 9 longs (call structures) and 8 shorts (put structures).
Among these were 8 winning trades with $72,770 in realized gains and 9 losing trades with $43,980 in realized losses.
The average winner generated $9,096 and the average loser was $4,887.
Average ($) Winner to Loser ratio: 1.86x (9,096/4,887)
Winning to Losing ($) trades ratio: 1.65x (72,770/43,980)
Monthly return: 10.6%
Cumulative YTD Return: 101.22%
It is the job of every disciplined trader to maximize the winner-to-loser ($) ratio so you can still earn even when the count of losing trades exceeds winners.
That outcome is only possible when you cut losing positions and scale into winners.
This is how the classic trading dilemma resolves: identify positions that are unlikely to turn into winners over time, cut the losses, and redirect capital to the winners or initiate new, higher-conviction ideas.
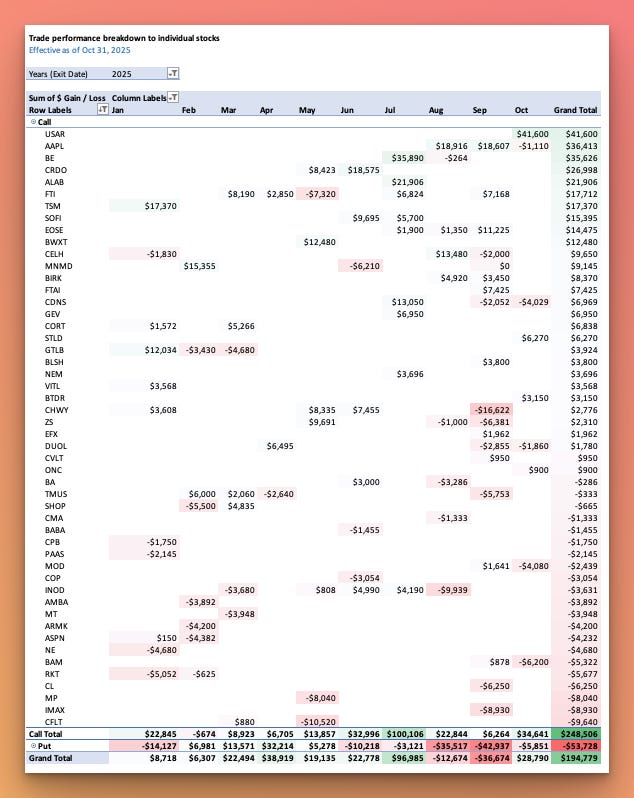
Here is the October realized P/L breakdown by the specific trades executed:
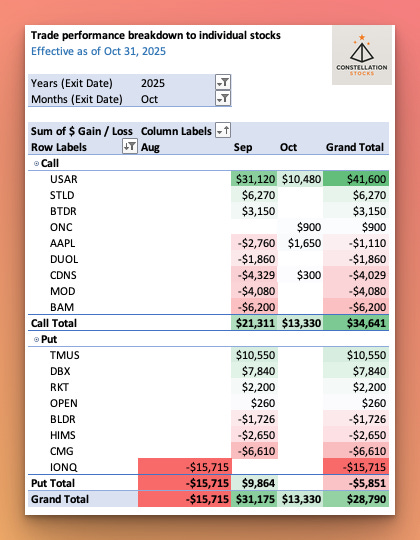
Months in columns indicate when the trades were initiated.
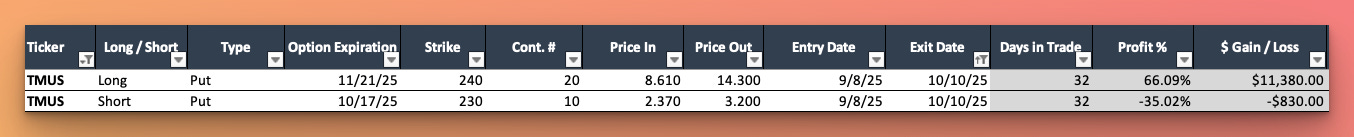
My portfolio P&L was driven by a handful of positions that had the largest impact on overall results. They were helped positively by USAR 0.00%↑, TMUS 0.00%↑ and negatively by IONQ 0.00%↑.
These were the option trade structures:
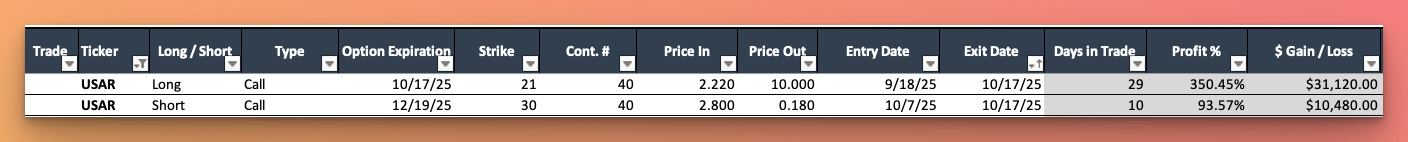

The reasoning behind the trades was shared throughout the month.
Major indices rose in October, primarily led by the Technology sector and AI-related stories.

YTD Performance
I am running this strategy for the second year.
In 2024, I focused on improving the robustness of the approach and ran many experiments that did not translate into consistent returns, finishing the year roughly flat. The backdrop was favorable for a long/short framework, with plenty of volatility events, but a lack of experience in risk management and idea-generation processes limited performance at that time.
In 2025 I am doing much better and feel I can deliver value to those starting their journey in trading in general and stock options specifically.
Cumulative YTD Return in October reached 101.22%.
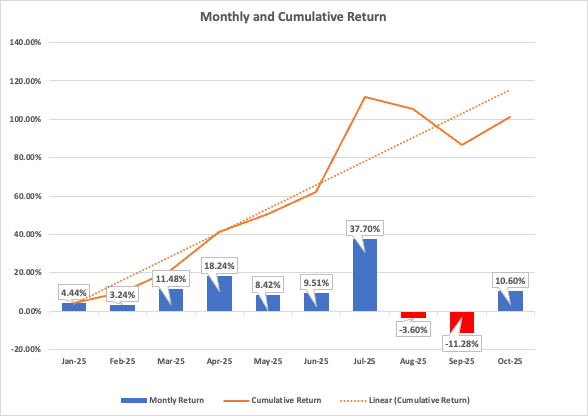
I’ve improved the risk management process and look forward to reaching July’s ATH by the end of the year.
YTD breakdown by particular trades:
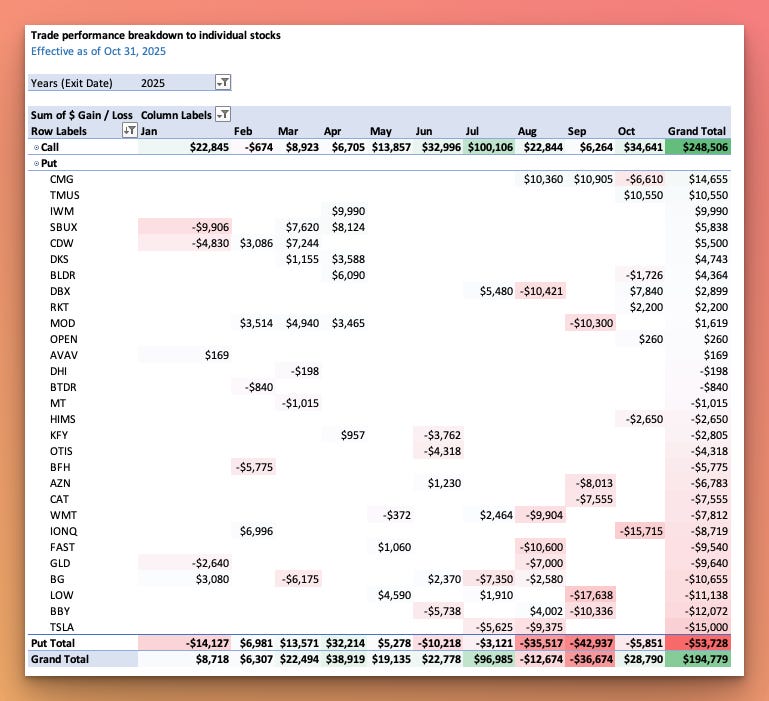
The strategy performs especially well during periods of elevated market volatility, such as April and July 2025.
Why Long / Short Portfolio
At their core, options allow you to capture non-linear returns from price moves and changes in volatility.
The trap appears when you run only one-sided exposure. If you hold a basket of long calls across names and the market turns, premiums can decay to zero.
The solution is balance. Combining longs and shorts, and carefully selecting underlyings and structures, lets you build a portfolio where winners outweigh losers and the process compounds over time.
More in the Options Playbook
Alongside these monthly performance reports, I share real-time trade actions and market views in the Options Playbook section of this newsletter.
Consider becoming a paid subscriber to access everything and stay aligned with my trading journey.
All subscribers receive a free guide with theory and practical cases in stock options trading.
Now we have three premium tools available for paid subscribers:
Substack chat, where I comment on markets and trades.
Portfolio Dashboard, to track trades I execute live and to monitor my current long and short options book.
Stock Ideas Pipeline, where I track, analyze, and prepare stock ideas before they turn into trades.