

The Real Story Behind This Pullback
Where we really are in the cycle and why markets are resetting, not breaking.

Zoom Out to Macro
Last week, a popular media narrative tried to explain why the stock market was down:
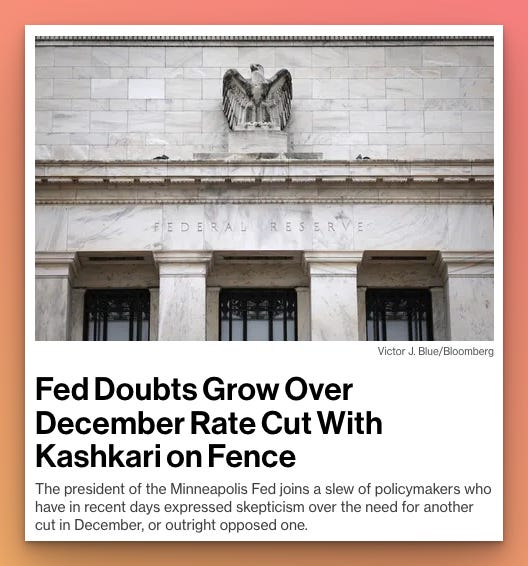

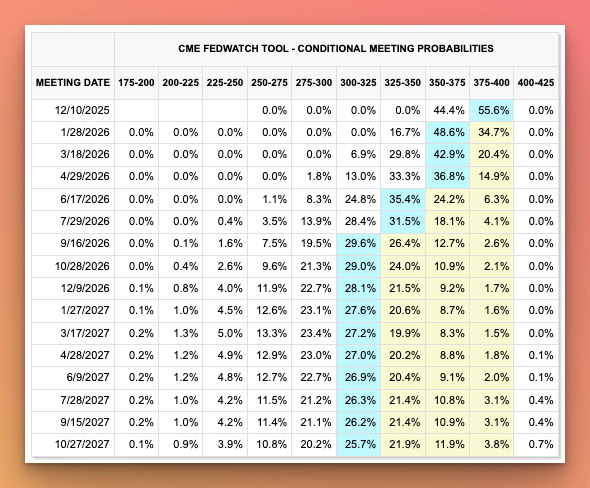
The market reacted accordingly by pricing in a no-change decision for the Federal Reserve at its next meeting on December 10, 2025 (as indicated by CME FedWatch data).
How robust is this explanation?
We know the labor market has continued cooling, but nothing too dramatic. Continuing jobless claims, a proxy for the number of people receiving unemployment benefits, reached 1.94 million in the week ended Nov. 1. That’s only slightly higher than the 1.93 million in the week ended Sep. 13, which was the last available official reading before the government shutdown.
Private businesses added 42,000 jobs in October 2025, according to the ADP Employment Change report, indicating modest job growth.
Other economic indicators don’t show significant weakness either. The ISM Manufacturing PMI and ISM Services PMI for October held steady.
In fact, ISM Services (which forms the backbone of the U.S. economy) signaled continued expansion.
Next week, we’ll start seeing the economic data releases that were delayed by the shutdown, bringing the schedule back on track.
Constellation Stocks still expects another rate cut at the December FOMC, but admittedly this is largely guesswork. Either way, we don’t anticipate the December rate decision to have any meaningful impact on the markets.
Why?
Because we don’t see any signs of an impending recession or stagflation. Even if the Fed keeps rates at current levels, it would reassure markets that the U.S. economy and GDP growth are still solid — key pillars of our bullish outlook.
Given this backdrop, we view corporate earnings as the crucial force driving the market now. In the S&P 500, the Q3 earnings season beat historical averages for both revenue and EPS, and the revision trend for Q4 2025 is looking up.
The main risk we see today is the Fed waiting too long to cut rates. However, that risk seems distant at the moment, as the Fed appears highly attentive to labor market layoffs and the health of consumer spending.
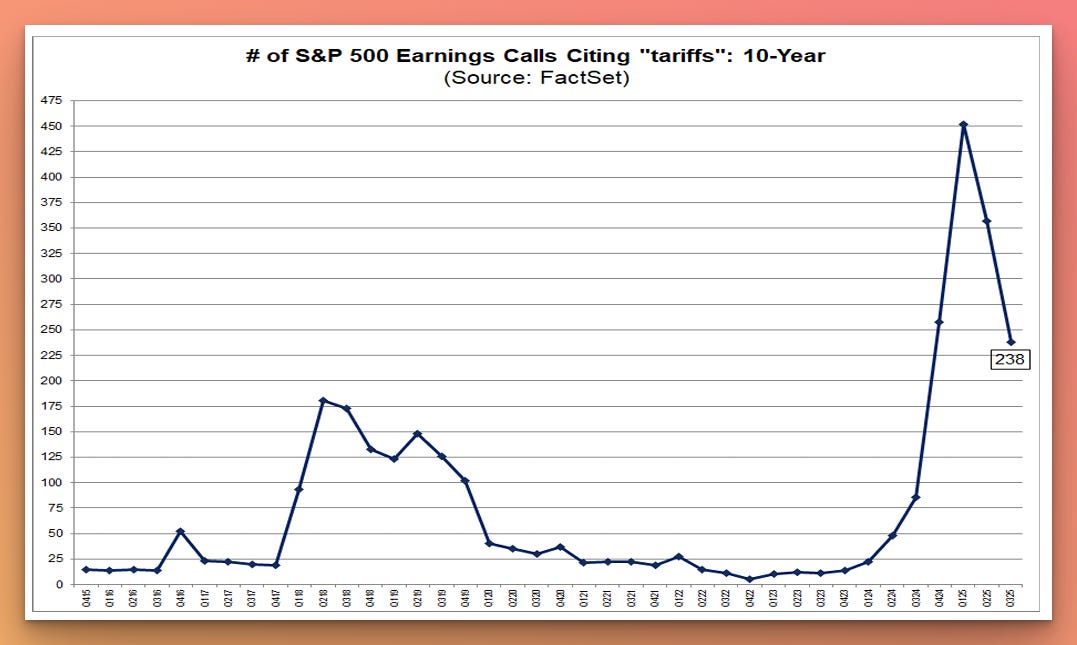
Inflationary pressures from tariffs are also easing, far fewer CEOs cited tariffs as an inflation concern this earnings season.
(We’ll discuss our place in the post-COVID inflationary cycle, and how well the Fed is reacting to it, in the “Piece of Knowledge” section later on.)
Zoom In on Corporate Earnings
Thus far, 92% of S&P 500 companies have reported actual results for Q3 2025. Of these, 82% posted EPS above analyst estimates — above the 5-year average (78%) and the 10-year average (75%).
On the revenue side, 76% of S&P 500 companies have reported actual revenues above estimates, exceeding the 5-year average (70%) and the 10-year average (66%).
This quarter is on track to mark the highest net profit margin for the S&P 500 in FactSet’s records (which go back to 2009). The previous peak net margin was 13.0% (in Q2 2021). Q3 2025 also represents the seventh consecutive quarter of rising profit margins.
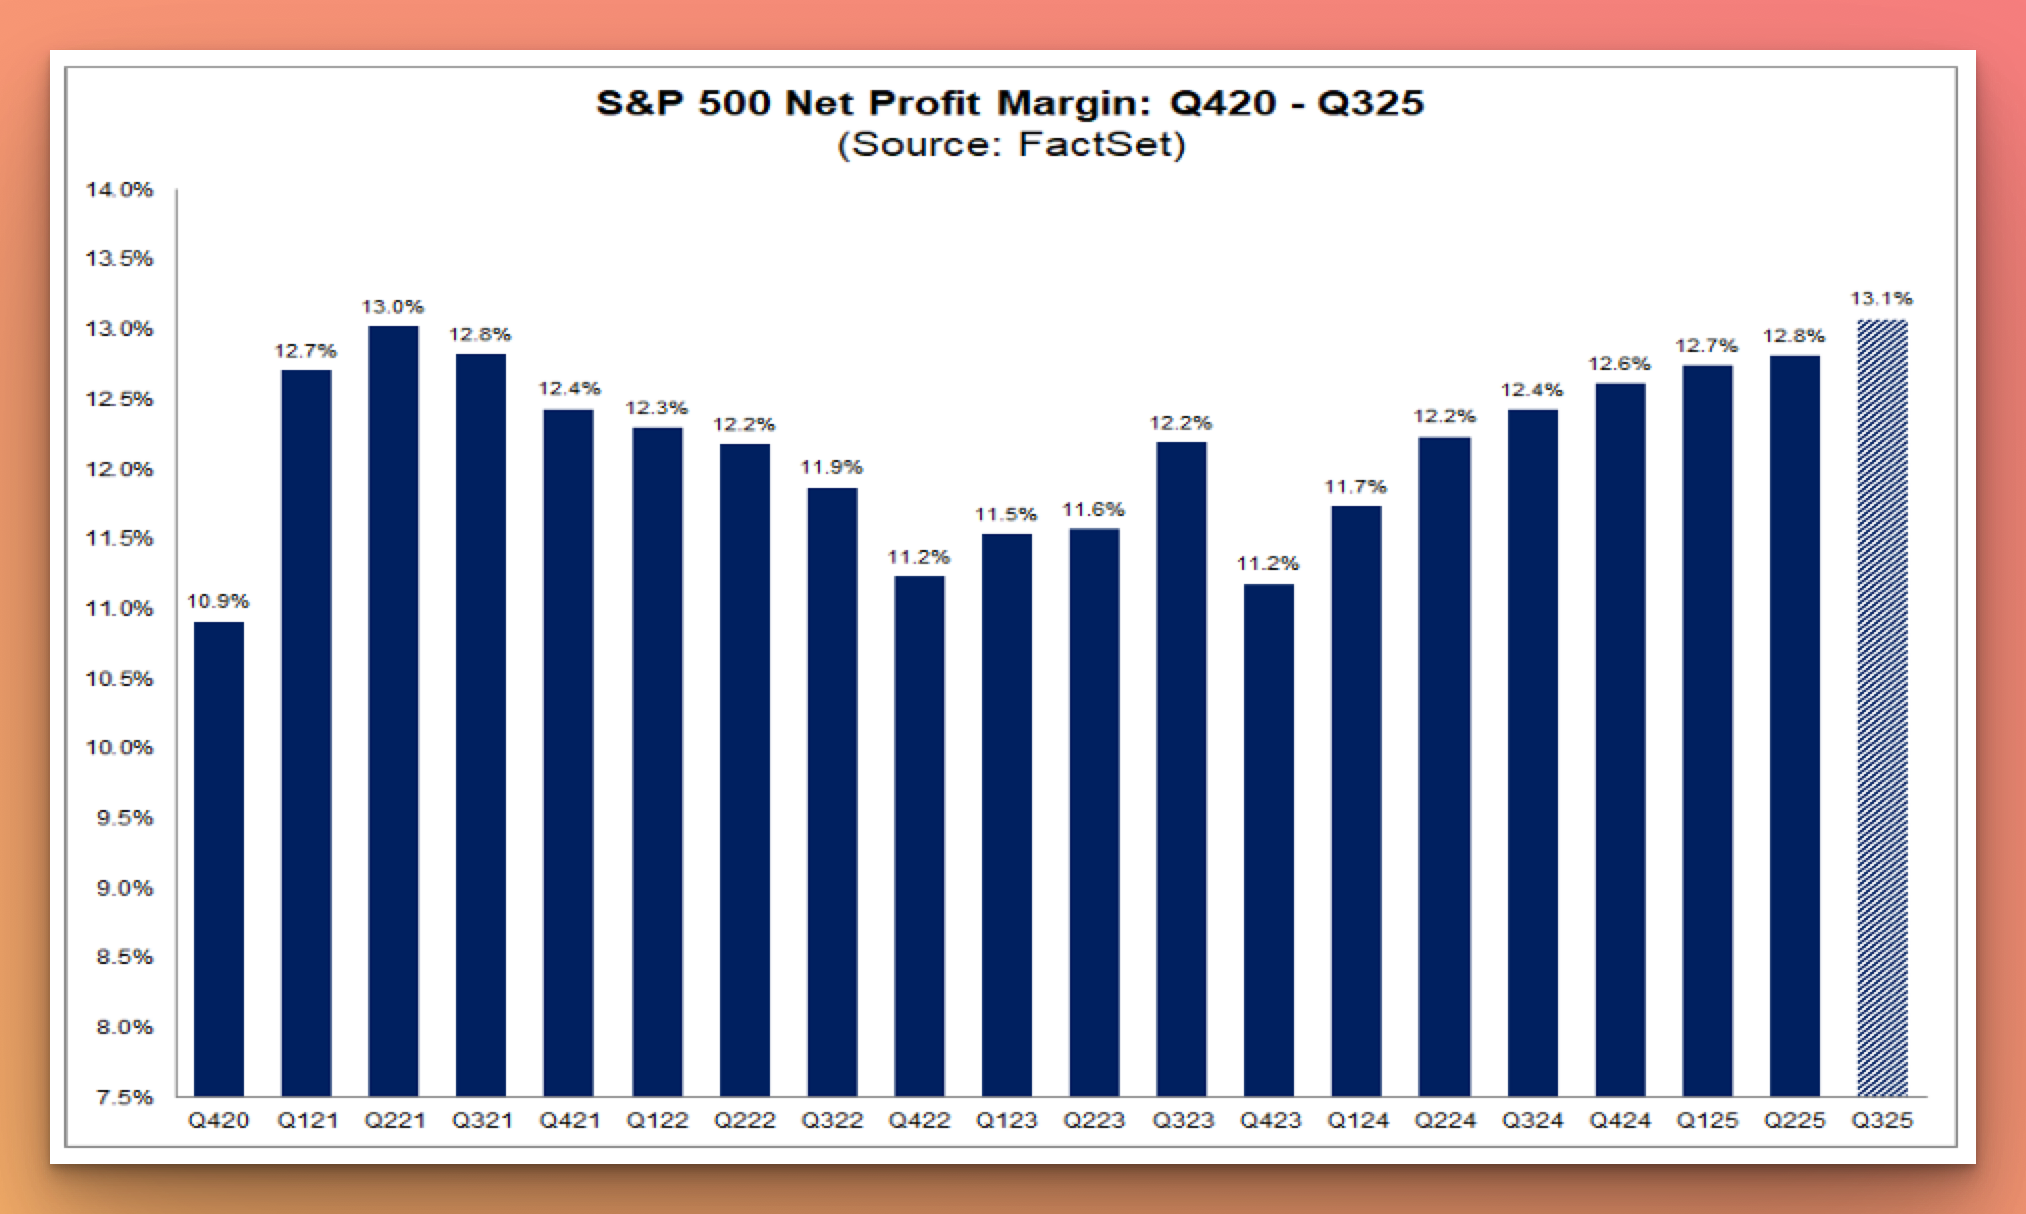
Looking ahead, analysts believe net profit margins will be even higher in 2026. Currently, the estimated net profit margins for Q4 2025, Q1 2026, and Q2 2026 are 12.8%, 13.3%, and 13.7%, respectively.
We are also seeing upward revisions for upcoming results. Expectations for Q4 2025 earnings and revenues have been revised higher since September 30.
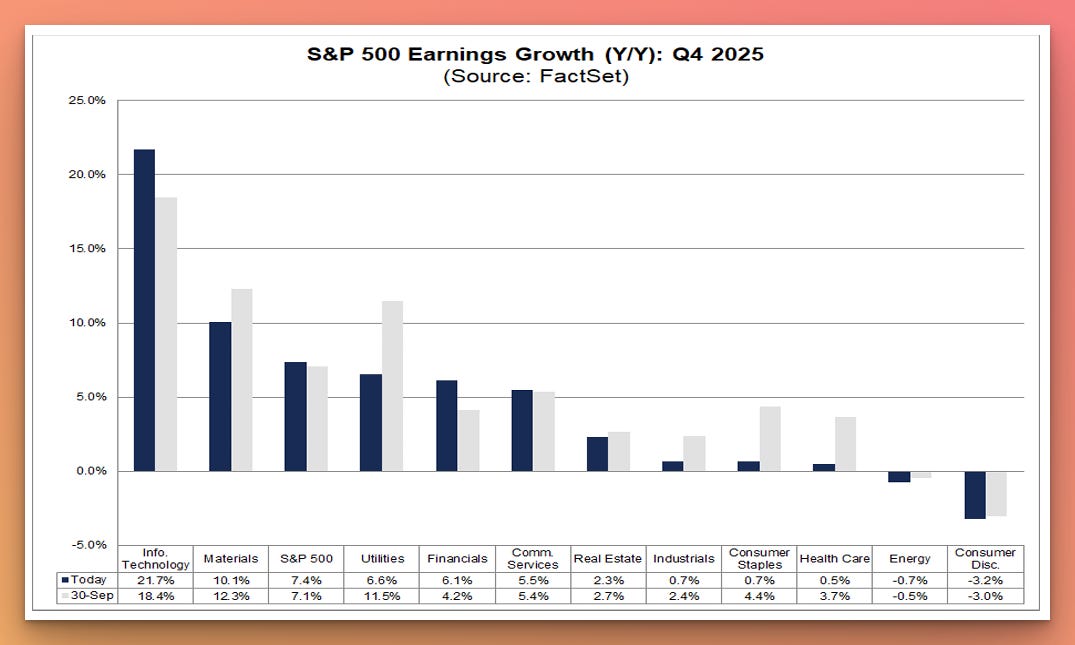
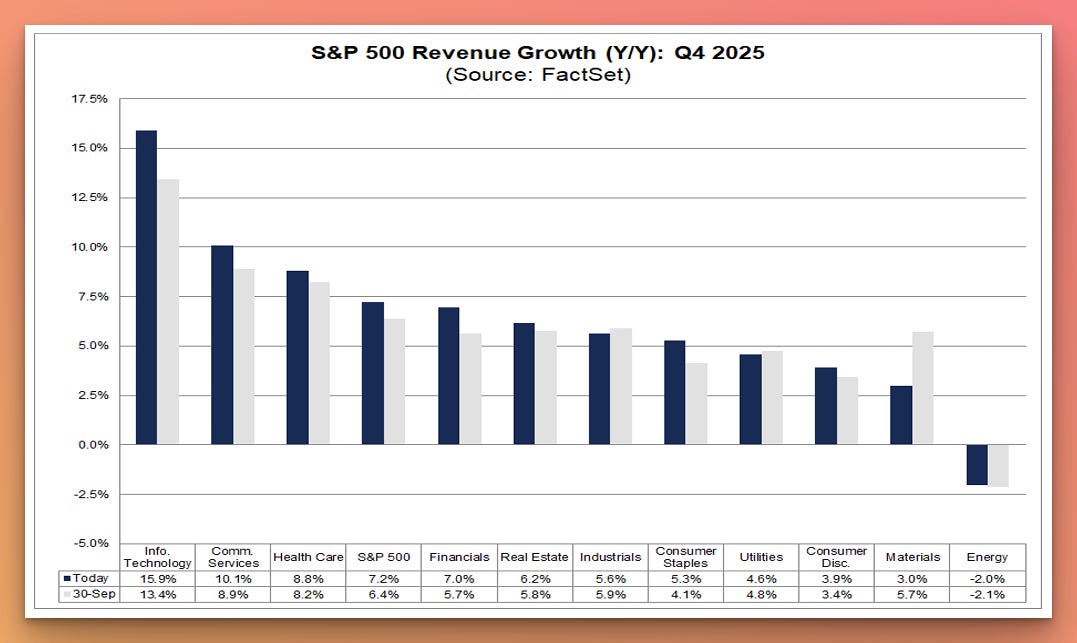
There remains a wide discrepancy between sectors (as usual), but overall the trend is positive.
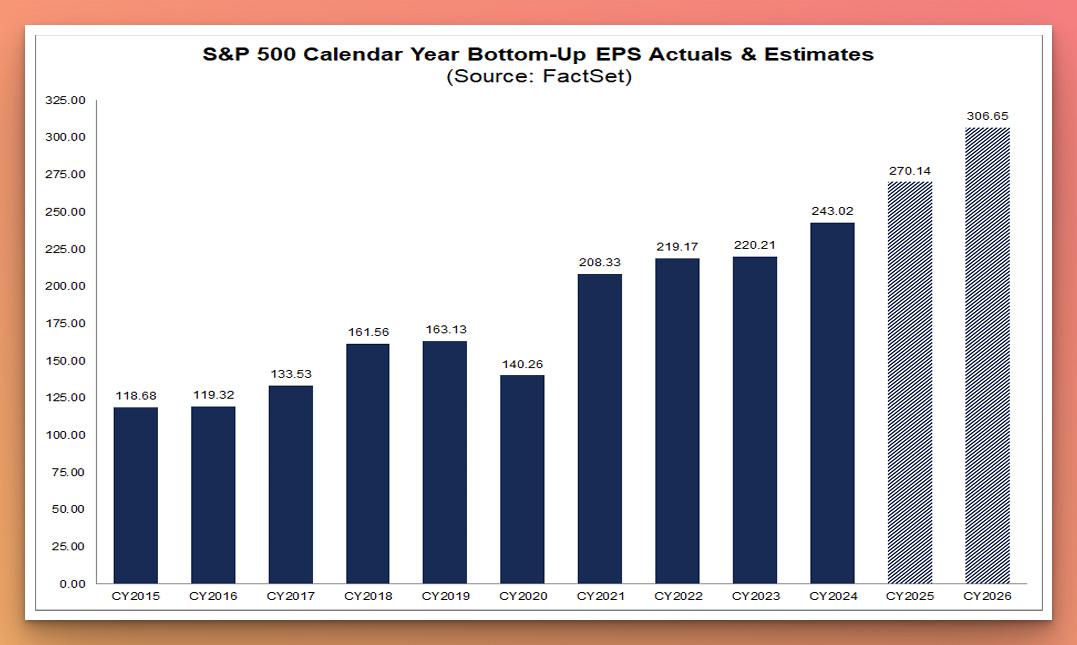
Even more encouraging, earnings forecasts for 2026 have been bumped up as well — now implying about 13% year-over-year earnings growth for the S&P 500 next year.
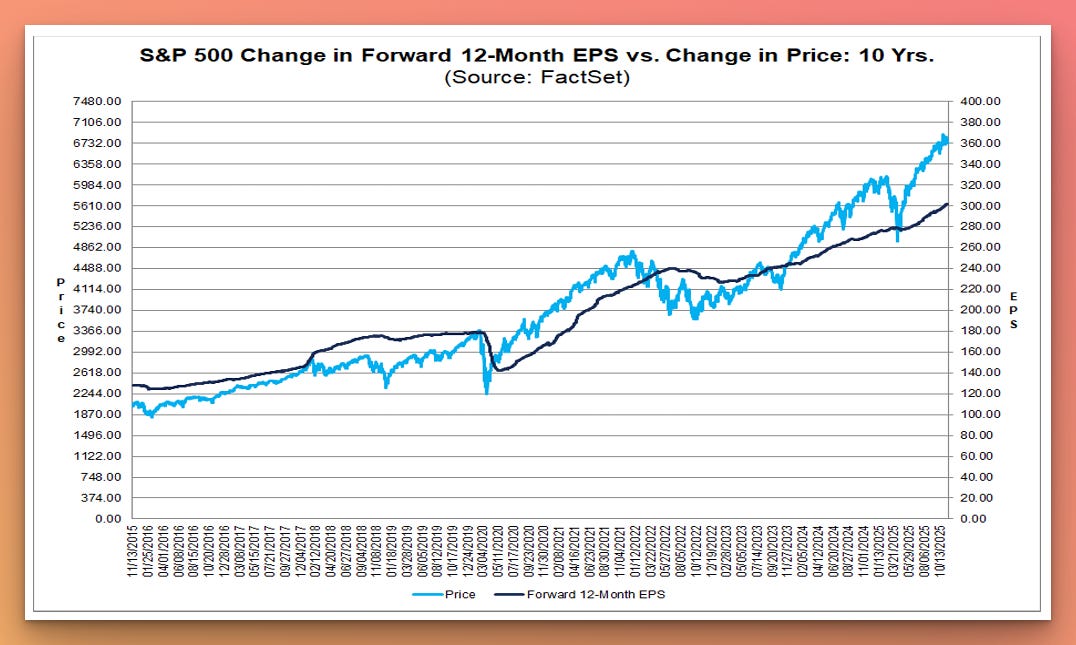
It’s important to remember how much future earnings drive current market conditions. On average, the market prices in earnings about 2–3 quarters ahead. If any factor emerges that could hurt future growth, the market will react swiftly. And if such a headwind looks like it will persist, it can pull the market down and let the bears take over.
One concern we’ve heard is that valuations are stretched: the S&P 500’s forward 12-month P/E ratio is near an all-time high, prompting skeptics to warn of a “bubble”.
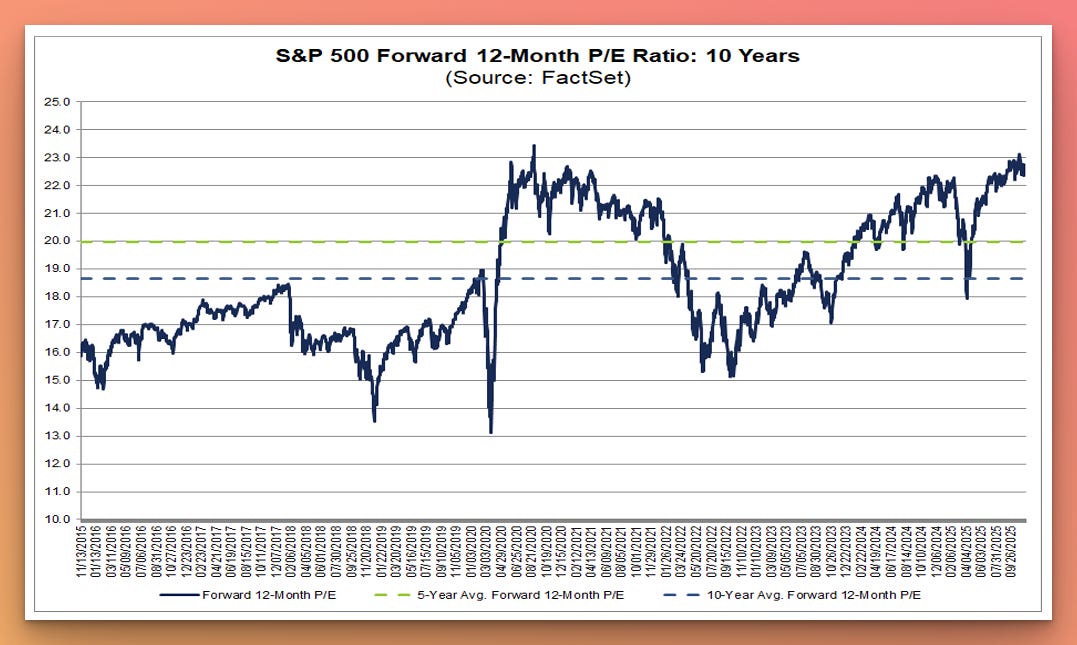
However, P/E ratios need to be viewed in the context of growth. We often consider the forward PEG ratio (forward P/E divided by expected earnings growth) to gauge valuation. Right now, the S&P 500’s forward PEG is around 2.34×, which in our view doesn’t signal an overbought market.

Even “Magnificent 7” have forward P/E multiples that appear reasonable, with no clear signs of bubble-like conditions.

So, what’s actually happening in the market today?
We see the current pullback as a healthy rotation between industries and sectors, a normal correction within an ongoing bull market.
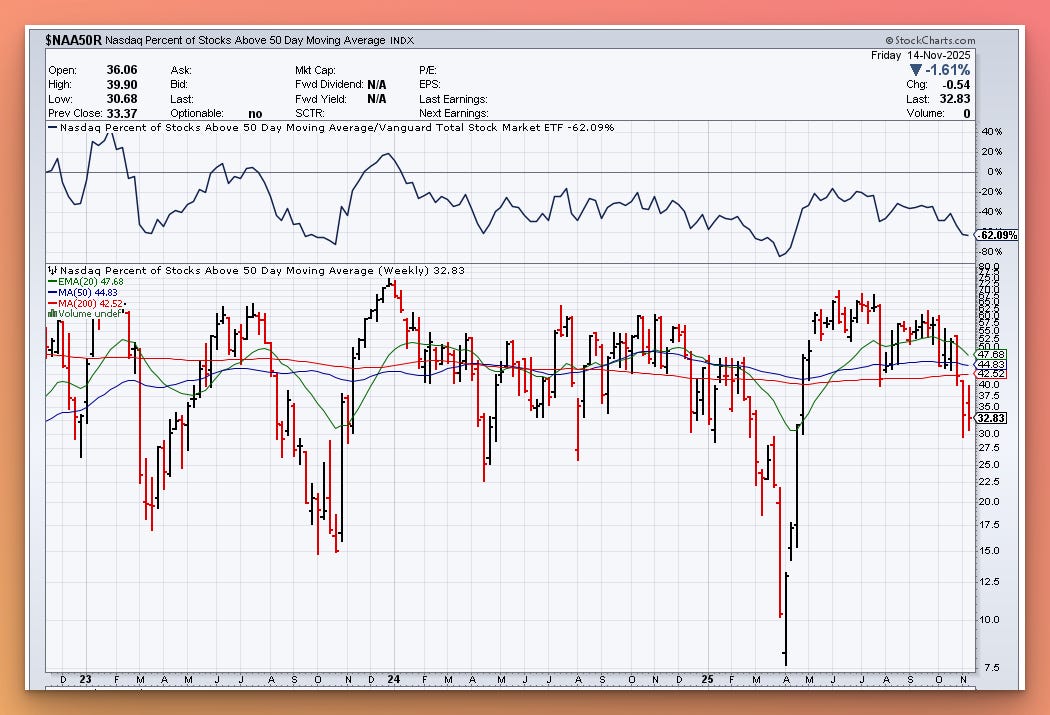
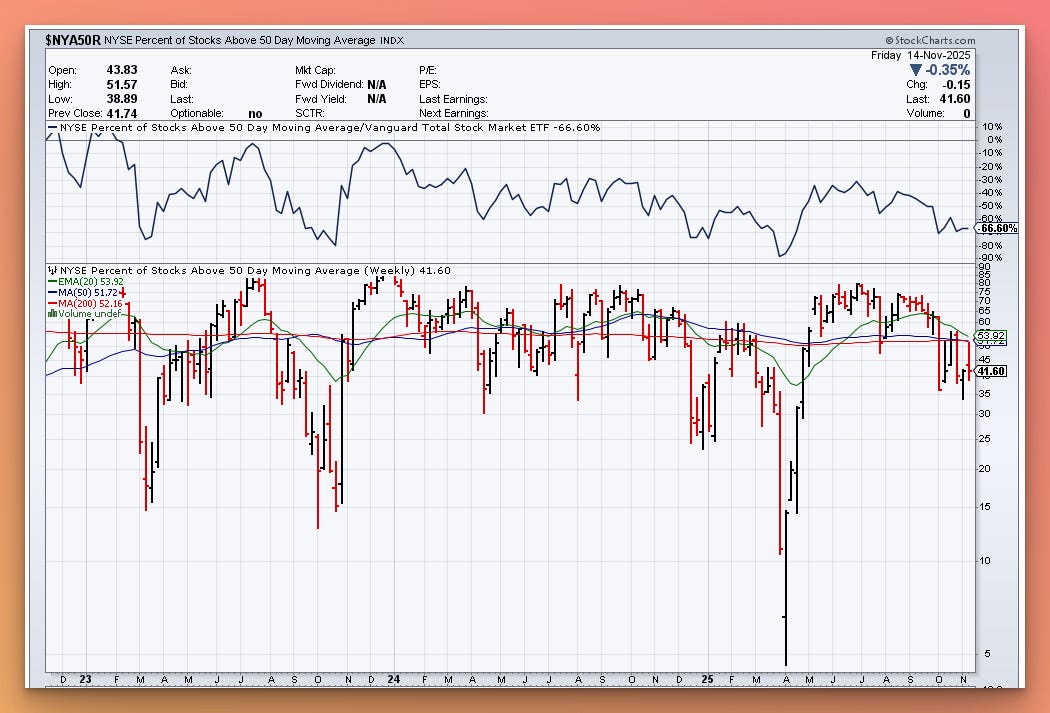
Stocks listed on the Nasdaq have been sold off more heavily than those on the NYSE, meaning the downturn has been concentrated largely in tech rather than spread across all sectors.
In fact, the market breadth is weaker on the Nasdaq: a smaller percentage of Nasdaq stocks remain above their 50-day moving averages compared to NYSE stocks, underscoring the tech sector’s relative weakness.
Potential Triggers Behind the Pullback:
Profit-taking in high-flying stocks (especially AI-related). Many stocks with stretched valuations, particularly in the AI sector, are experiencing a pullback after a period of rapid gains.
It appears we may be near a peak in revenue growth rates for the overall AI theme. The beneficiaries of the AI boom will continue to grow, but at a slower pace.
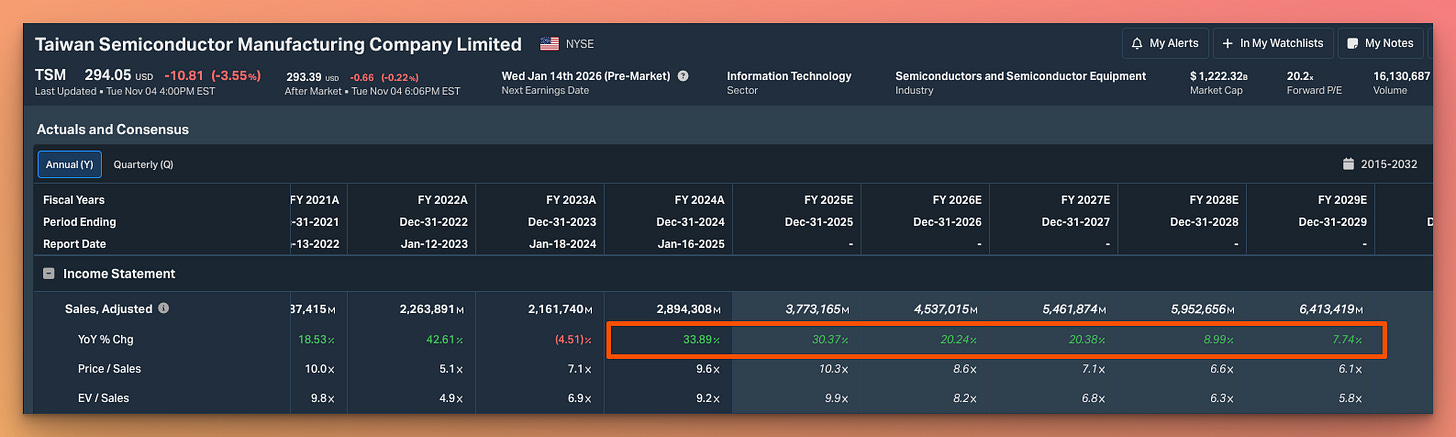
For example, $TSM, the leading semiconductor foundry’s revenue, is forecast to keep growing over the next three years, but at a decelerating rate. To justify future stock price appreciation, these companies eventually need to “reset” to a lower growth trajectory. The pullback we see now is likely that “reset”. After this, valuations can still rise further, just on a more gradual growth path.
Could growth rates accelerate again? Absolutely — new capital expenditure (CAPEX) announcements (for data centers, AI hardware, etc.) could re-ignite growth and are worth watching. But for now, current forecasts already reflect the CAPEX plans announced so far.
Revised timelines for AI investments paying off. Investors may be adjusting expectations on how quickly massive tech CAPEX will translate into profits.
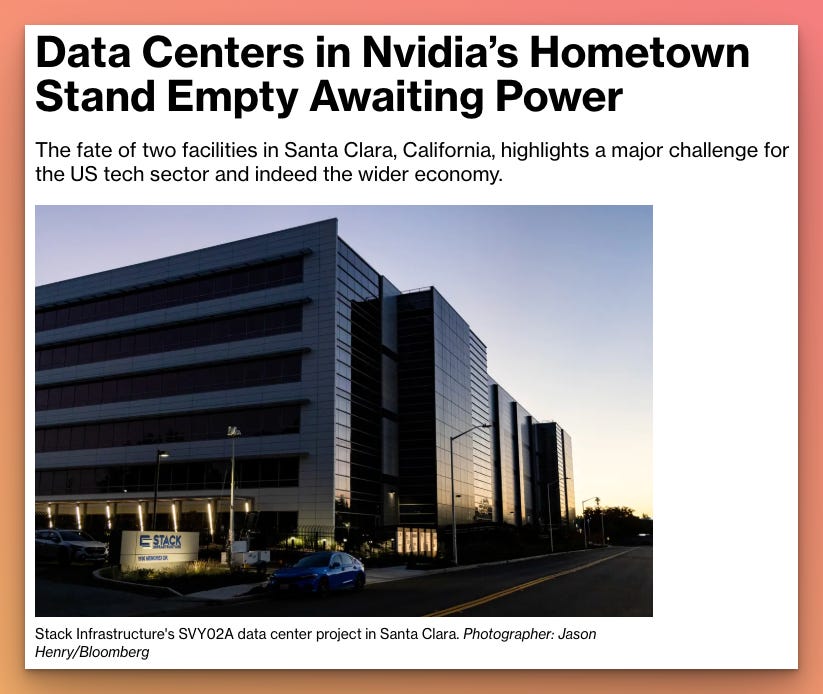
A bottleneck in power generation has started to affect the timeline for bringing new AI data centers online.

Bloomberg In other words, the huge investments in AI infrastructure may take longer to yield “new” money due to these power and capacity constraints.

With all that said, here’s how we’re positioning our long/short stock options strategy as we head toward year-end.
👉 Inside the paywall:
Our L/S Stock Options Portfolio Update
Piece of Knowledge: How Modern Monetary Policy Operates
📊 YTD, our strategy's cumulative return is +101.22%.
📩 Upgrade to a paid plan to unlock access to our live trades, analytical tools, and private chat community.
