

How to screen a stock in 5 minutes
Busy schedule? Filter stocks fast without missing key signals

No one wants to spend 20 hours per week on stock research.
Especially if you also have a busy full-time job, kids and a family
But in this article, I’ll show you how to determine if a stock is worth researching in less than 5 minutes.
The framework here is a part of the $15,000 professional trading training I purchased in 2023.
If you are not a part of Constellation Stocks, subscribe below: 👇
Find a reason to say ‘no’ as soon as possible
When I analyze a stock, I try to find a reason to say ‘no’ as soon as possible. When you haven’t found a reason within a few minutes, you have found an interesting stock.
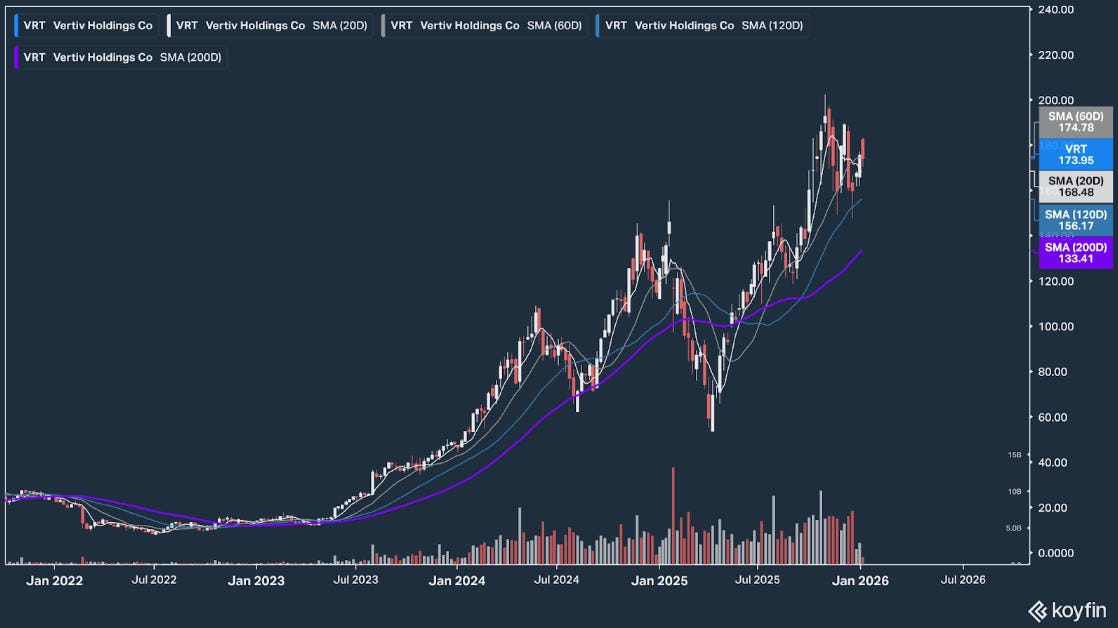
I’ll teach you how to do a quick stock screening in 7 steps via the free Koyfin analytical platform. We take a growth company, Vertiv Holdings ($VRT), as an example.
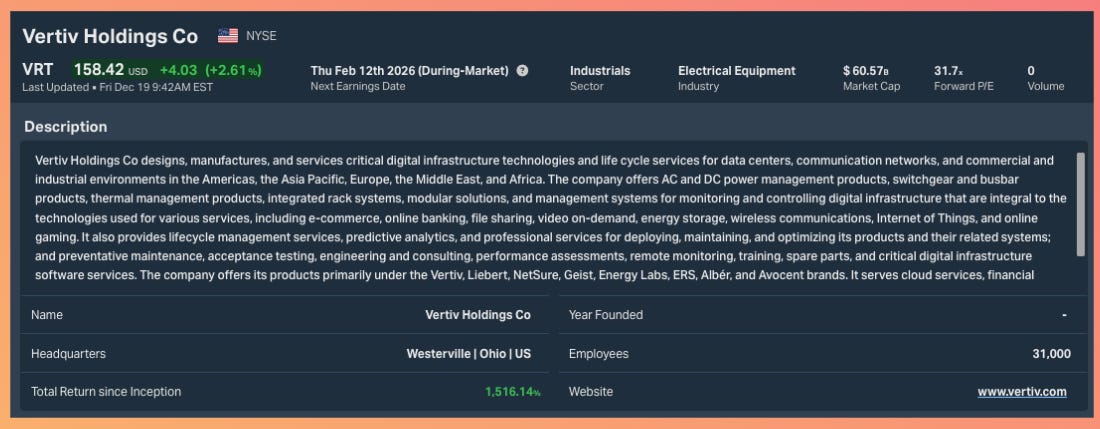
Step 1: Business first: what does the company actually do?
Go to the ‘Snapshots / Description’ and look at the description:
What products or services does the company sell?
Which end markets does it serve?
What is the sales geography (US, Europe, global, emerging markets)?
If you can’t explain the business in one or two sentences, stop here.
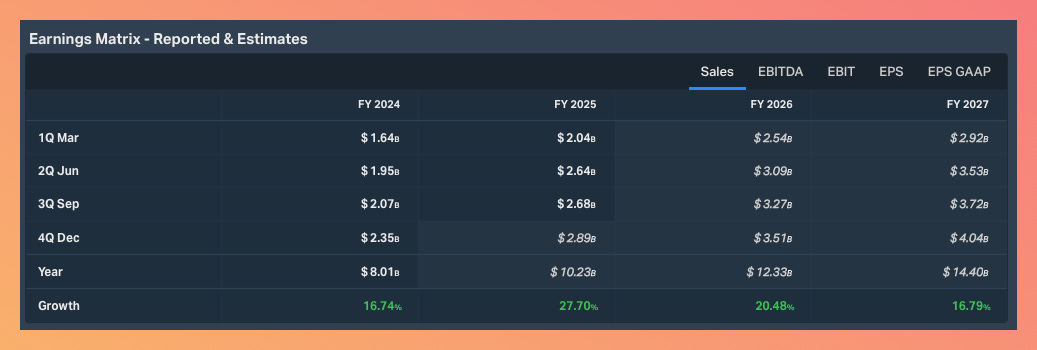
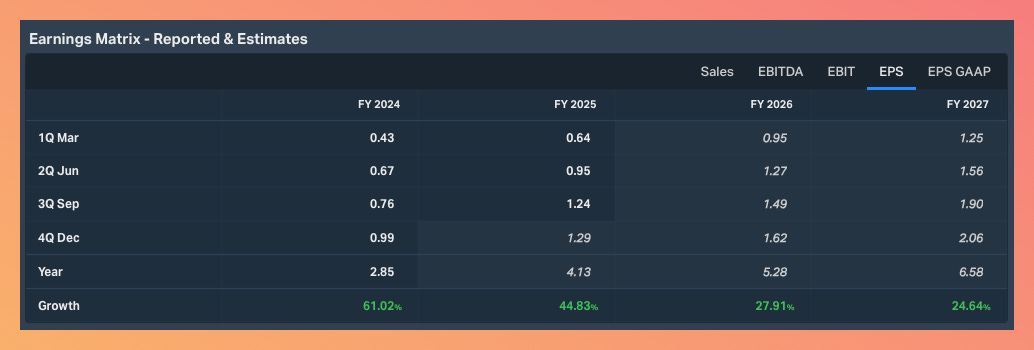
Step 2: Growth profile: Where is the company going?
Go to the ‘Analyst Estimates / Estimates Overview’ and look at the company growth.
Markets care more about the future than the past.
Focus on consensus forecasts (the experts’ best guess) for the next 1–2 years:
Revenue growth 10%+
EPS growth 10%+
When most experts predict a company will grow by 10% or more, it is a great sign that the business is a growth stock and is expected to do better than the rest of the market.
VRT is a growth stock 👇
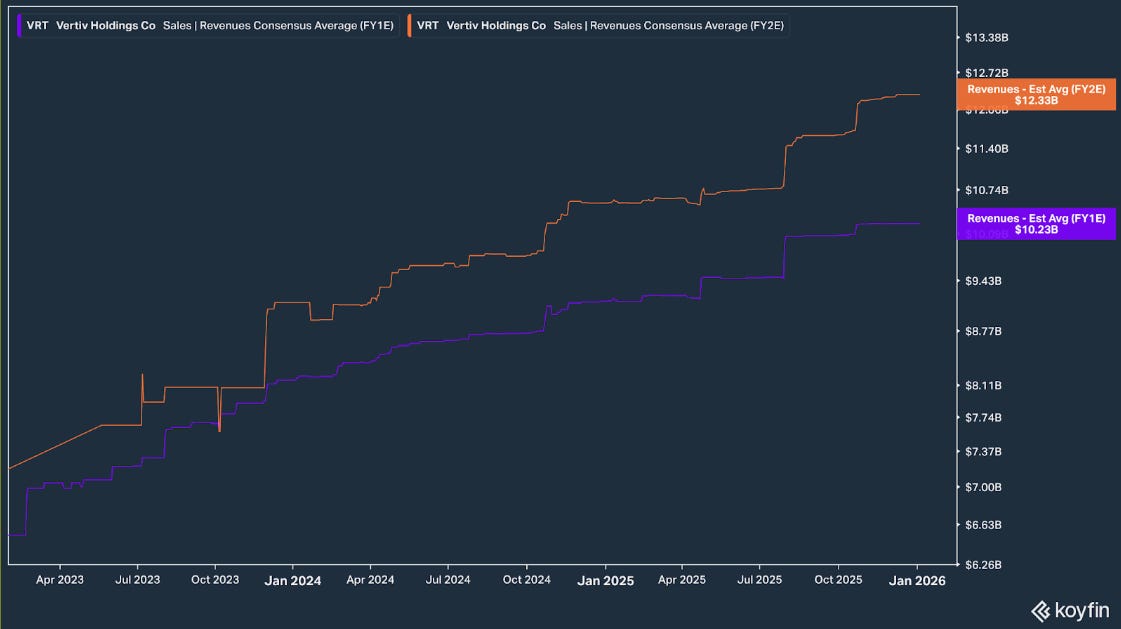
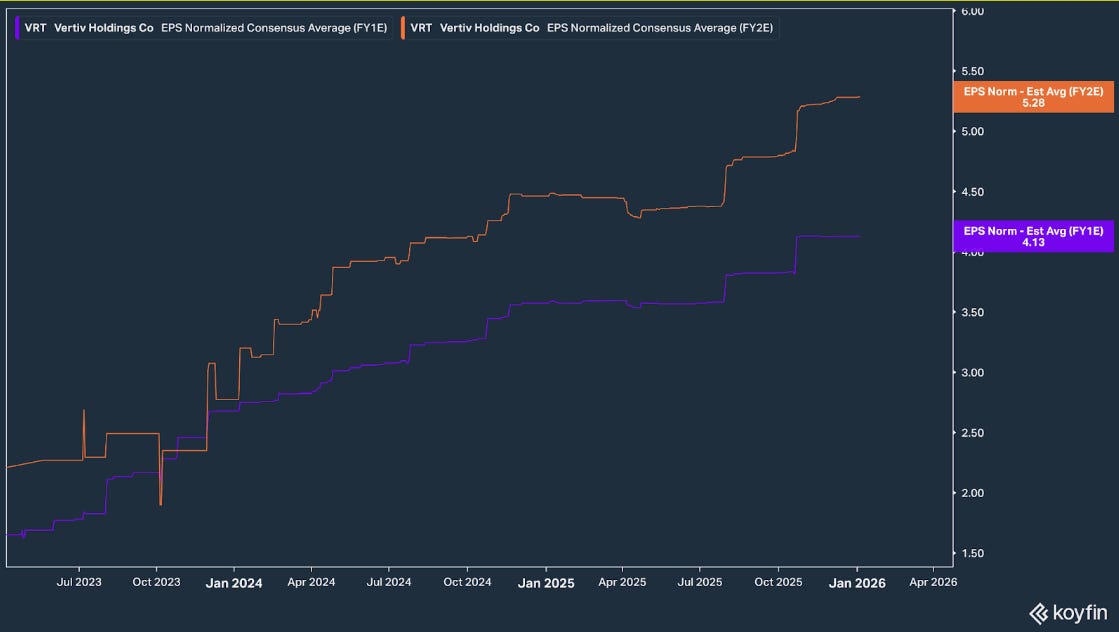
Step 3: Revisions: what are analysts changing?
Go to the ‘Analyst Estimates / Estimates Trends‘ and look at the consensus revisions.
What are consensus revisions? When all the experts change their minds together and raise their guesses about how much a company will earn, it’s called a consensus revision.
For longing a stock you’d want an upward trending revision trend:
Increase in the Revenue estimate revisions
Increase in the EPS estimate revisions
Positive revisions often matter more than absolute growth numbers.
When a company has an upward trending revision trend it indicates a fundamental momentum. While a static “consensus forecast” tells you what the market currently expects, the trend of revisions tells you where the market is going.
VRT ticks the Revenue and EPS estimate revisions boxes. All lines are trending upwards.
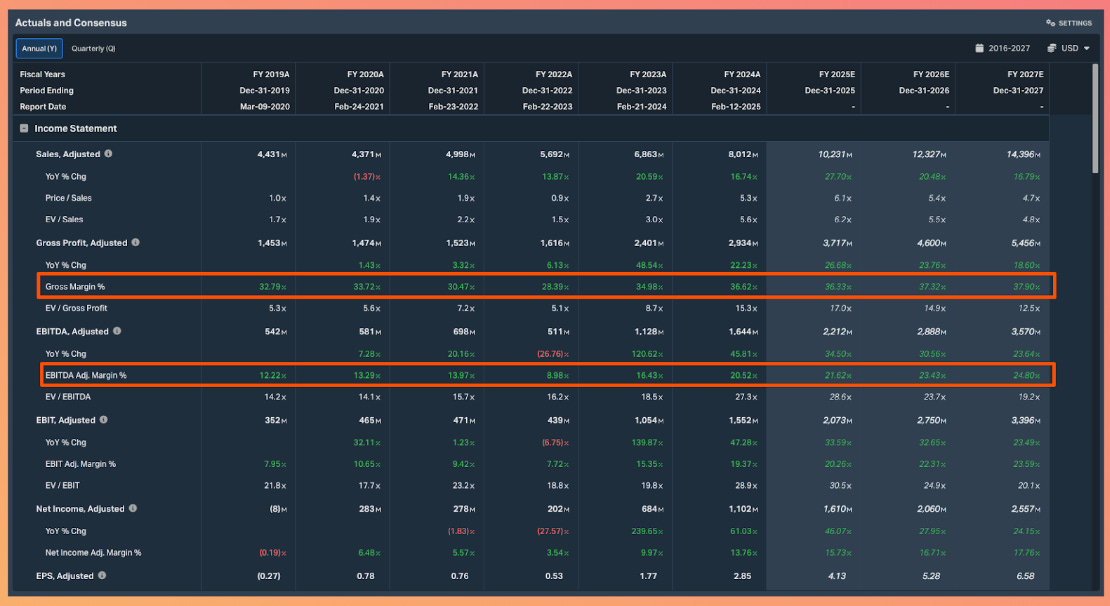
Step 4: Margins: the quality of growth
Go to the ‘Analyst Estimates / Actuals and Consensus‘.
To determine the true quality of a business, you must look past top-line revenue and focus on margins. While many companies can grow sales, high-quality businesses convert that growth into increasing levels of profit through operating leverage.
I look at:
Yearly Gross margin growth
Yearly EBITDA margin growth
Analyzing the Trend, Not Just the Level
The specific number matters less than the direction of the trend. I look for specific signals:
Expansion vs. Shrinkage: Are margins growing as the company scales?
Stability vs. Volatility: Is the profitability predictable, or does it swing wildly with cycles?
Turnaround Potential: Is there a clear shift from negative to positive margins?
Why it Matters: Revenue growth without healthy margin dynamics is often “low-quality” growth. If costs rise faster than sales, the business model is fragile.
Vertiv Case Study: Confirmed Operating Leverage
$VRT$ is a prime example of high-quality growth. Its adjusted operating margin expanded from 20.1% in 2024 to an estimated 22.3% in late 2025. This expansion, driven by a shift toward high-margin liquid cooling products and procurement productivity, confirms that $VRT$ has powerful operating leverage. It is making more profit on every new dollar of AI-driven sales.
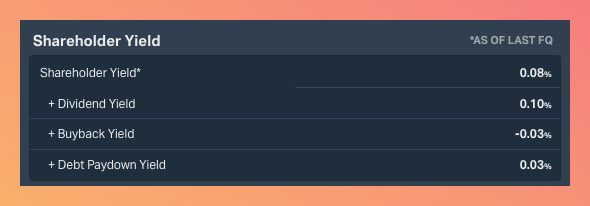
Step 5: Shareholder value: how management treats owners
Go to the ‘Snapshots / Dividend‘.
Evaluating a company’s growth isn’t enough; you must also evaluate how management handles the cash that growth generates.
We look at Shareholder Yield because it provides a holistic view of capital return that simple dividend yield misses.
Calculate the “Total” Shareholder Yield: Don’t just look at dividends. True shareholder value is the sum of:
Dividend Yield: Direct cash payments to you.
Buyback Yield: The percentage of shares management retired from the market.
Debt Paydown Yield: Cash used to strengthen the balance sheet and reduce interest risk
Benchmark Against the “Risk-Free” Rate: Compare this total yield to the US 10-year Treasury Yield (currently 4.17%).
Is there a clear premium? If a company’s shareholder yield is lower than the 10-year Treasury, you are effectively taking “equity risk” for a return lower than what you could get from a guaranteed government bond.
The Red Flag: Watching for “Stealth” Dilution. A critical reason we monitor Buyback Yield is to spot high share dilution.
If a company issues new shares, often through excessive stock-based compensation, it dilutes your ownership. A Buyback Yield deeper than -5% is a massive red flag. It means management is creating “new” shares faster than they can grow the business, which can sap the value of your holdings even if the company’s total profit is rising.
The VRT Strategy Note: VRT currently pays no dividends and runs no buyback program. For a high-conviction growth company, this is actually a positive signal. It indicates management is reinvesting 100% of their cash back into the business to capture the massive AI infrastructure boom, rather than trying to “manufacture” EPS growth through buybacks.
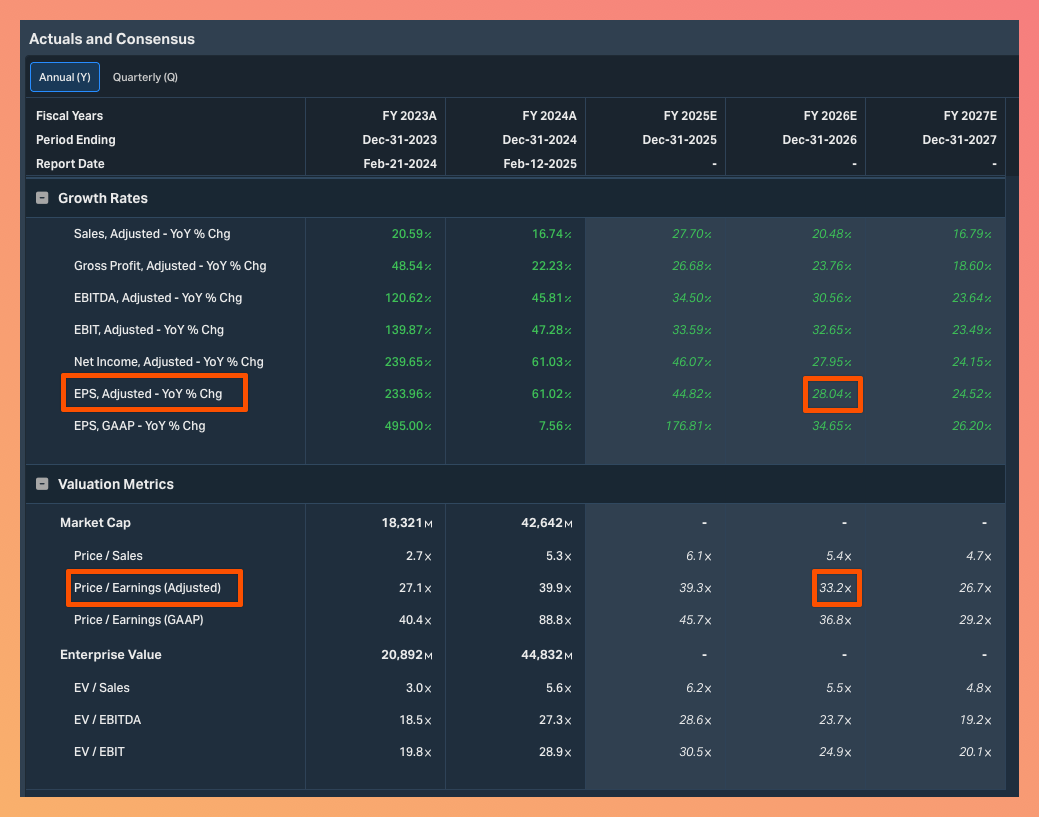
Step 6: The “Growth-Adjusted” Price Tag
Go to the ‘Analyst Estimates / Actuals and Consensus’.
When looking at $VRT$, the goal is to see if its rapid growth justifies its premium price. I use the PEG Ratio (Price-to-Earnings divided by Growth) to put the valuation in context:
PEG < 1 (A Bargain): You are paying less for the stock than its growth rate suggests it’s worth.
PEG ≈ 1 (Fairly Priced): The price is perfectly in sync with the company’s growth.
PEG > 1 (Premium Price): High expectations for future success are already “baked into” the current price.
The Current VRT Case Study
As of early 2026, $VRT$ presents a unique case of a “balanced” growth stock:
Forward P/E (~33x): On its own, this looks “expensive” compared to slower industries.
Next-12-Month (NTM) EPS Growth (28.04%): This is the “speed” at which the company is growing.
How it’s calculated: This 28% figure represents the consensus estimate from Wall Street analysts for $VRT$’s earnings growth over the next year. It is derived by comparing the estimated earnings for the next 12 months against the current year’s results.
The PEG Baseline (~1.18): By dividing the 33x P/E by the 28% growth rate, we get a PEG near 1.
The Verdict: The stock is fairly valued. Its price is rising with its actual earnings growth rather than getting ahead of it.
Pro Tip: “Expensive” does not mean “uninvestable”. High-performing companies can stay “expensive” for years if they keep beating expectations and maintaining their AI momentum.
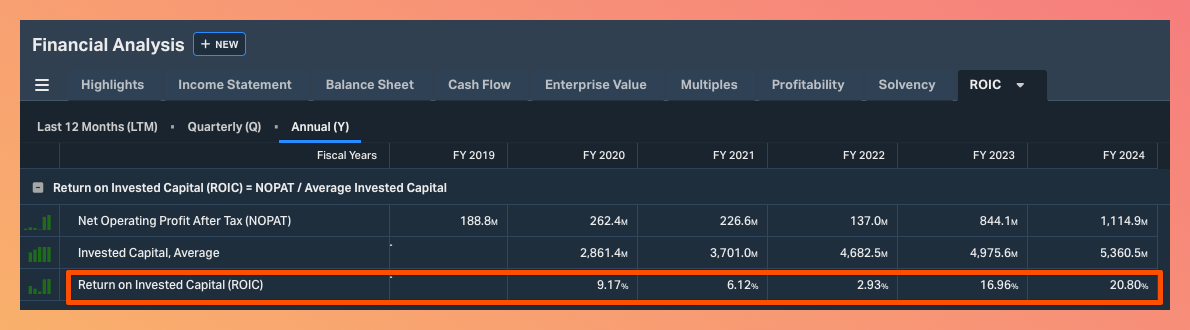
Step 7: Capital efficiency - ROIC
Go to ‘Financial Analysis / ROIC’
For longing stocks look for companies with a ROIC (Return on Invested Capital):
>10% for non-technology-driven companies
>15% for technology-driven companies
You want to look for companies that use their cash to generate even more growth.
VRT has had >15% ROIC in the last 2 years.
Potential high-quality growth stock
Did you not find anything that turned you off so far in these 7 steps? Great! You’ve found a potential Growth Stock! It’s time to put it on the watchlist and analyze it more thoroughly.
All in all, Vertiv is a leader in the development of cooling solutions for data centers and communication networks. Revenue and EPS double-digit growth is implied in the coming years, margins are expanding, and capital efficiency supports the growth narrative. Quantitatively, this makes Vertiv a strong potential long candidate.
Before pulling the trigger, you should always cover the scope of qualitative factors too:
Comparable Analysis
Earnings History of Beat/Miss
Management Guidance
Foreseen Valuation Catalysts
About the author
Iskan is a professional trader and investor who managed a private equity fund with $120 million in Assets Under Management. He has invested over $80,000 in his trading education and spends more than 50 hours per week researching stocks.
Disclaimer 1
As a reader of Constellation Stocks, you agree to our disclaimer. You can read the full disclaimer here.
Disclaimer 2
This post contains affiliate links. If you make a purchase through these links, I may earn a commission at no additional cost to you.
Question for you. I thought PEG already included growth rate. Why divide by it again. “The PEG Baseline (~1.18): By dividing the 33x P/E by the 28% growth rate, we get a PEG near 1.”
the gold nugget shipped here